对于程序开发工程师来说,调试几乎是必备技能。今天再给你介绍一款非常好用的调试工具,它能在一些场景下,大幅度提高调试的效率, 那就是 PySnooper,它在 Github 上已经收到了 14.2k 的 star,获得大家的一致好评。
1. 安装
安装 PySnooper
1
2
3
| $ python3 -m pip install pysnooper
or
$ conda install -c conda-forge pysnooper
|
2. 简单案例
下面这段代码,定义了一个 demo_func 的函数,在里面生成一个 profile 的字典变量,然后去更新它,最后返回。
代码本身没有什么实际意义,但是用来演示 PySnooper 已经足够。
 1
 2
 3
 4
 5
 6
 7
 8
 9
10
11
12
13
14
15
| import pysnooper
@pysnooper.snoop()
def demo_func():
profile = {}
profile["name"] = "hustbill"
profile["age"] = 27
profile["gender"] = "male"
return profile
def main():
profile = demo_func()
main()
|
现在我使用终端命令行的方式来运行它
 1
 2
 3
 4
 5
 6
 7
 8
 9
10
11
12
13
14
15
| [root@iswbm ~]# python3 demo.py
Source path:... demo.py
17:52:49.624943 call 4 def demo_func():
17:52:49.625124 line 5 profile = {}
New var:....... profile = {}
17:52:49.625156 line 6 profile["name"] = "hustbill"
Modified var:.. profile = {'name': 'hustbill'}
17:52:49.625207 line 7 profile["age"] = 27
Modified var:.. profile = {'name': 'hustbill', 'age': 27}
17:52:49.625254 line 8 profile["gender"] = "male"
Modified var:.. profile = {'name': 'hustbill', 'age': 27, 'gender': 'male'}
17:52:49.625306 line 10 return profile
17:52:49.625344 return 10 return profile
Return value:.. {'name': 'hustbill', 'age': 27, 'gender': 'male'}
Elapsed time: 00:00:00.000486
|
可以看到 PySnooper 把函数运行的过程全部记录了下来,包括:
- 代码的片段、行号等信息,以及每一行代码是何时调用的?
- 函数内局部变量的值如何变化的?何时新增了变量,何时修改了变量。
- 函数的返回值是什么?
- 运行函数消耗了多少时间?
而作为开发者,要得到这些如此详细的调试信息,你需要做的非常简单,只要给你想要调试的函数上带上一顶帽子(装饰器) – @pysnooper.snoop() 即可。
3. 详细使用
2.1 重定向到日志文件
@pysnooper.snoop() 不加任何参数时,会默认将调试的信息输出到标准输出。
对于单次调试就能解决的 BUG ,这样没有什么问题,但是有一些 BUG 只有在特定的场景下才会出现,需要你把程序放在后面跑个一段时间才能复现。
这种情况下,你可以将调试信息重定向输出到某一日志文件中,方便追溯排查。
1
2
3
| @pysnooper.snoop(output='/var/log/debug.log')
def demo_func():
...
|
2.2 跟踪非局部变量值
PySnooper 是以函数为单位进行调试的,它默认只会跟踪函数体内的局部变量,若想跟踪全局变量,可以给 pysnooper.snoop() 加上 watch 参数
1
2
3
4
5
| out = {"foo": "bar"}
@pysnooper.snoop(watch=('out["foo"]'))
def demo_func():
...
|
如此一来,PySnooper 会在 out["foo"] 值有变化时,也将其打印出来
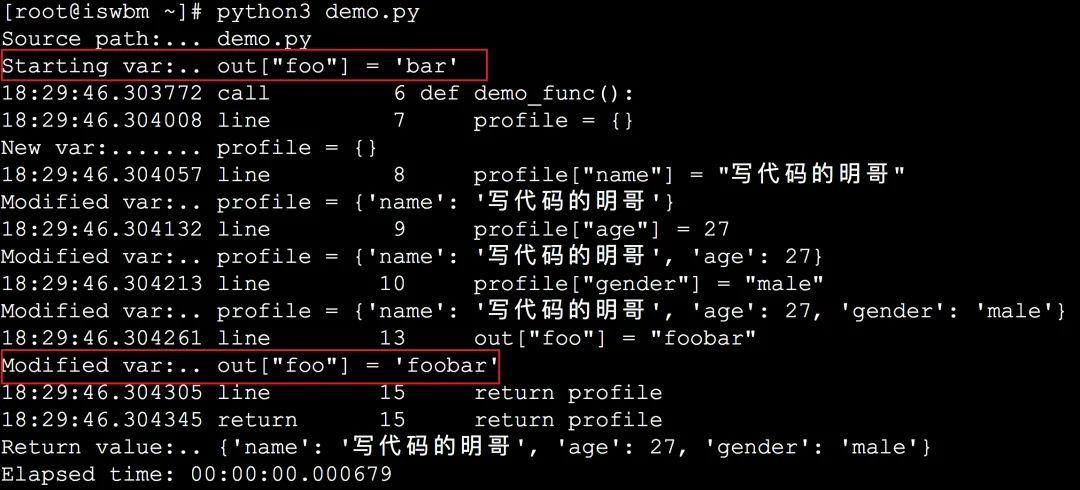
watch 参数,接收一个可迭代对象(可以是list 或者 tuple),里面的元素为字符串表达式,什么意思呢?看下面例子就知道了
1
2
3
| @pysnooper.snoop(watch=('out["foo"]', 'foo.bar', 'self.foo["bar"]'))
def demo_func():
...
|
和 watch 相对的,pysnooper.snoop() 还可以接收一个函数 watch_explode,表示除了这几个参数外的其他所有全局变量都监控。
1
2
3
| @pysnooper.snoop(watch_explode=('foo', 'bar'))
def demo_func():
...
|
2.3 设置跟踪函数的深度
当你使用 PySnooper 调试某个函数时,若该函数中还调用了其他函数,PySnooper 是不会傻傻的跟踪进去的。
如果你想继续跟踪该函数中调用的其他函数,可以通过指定 depth 参数来设置跟踪深度(不指定的话默认为 1)。
1
2
3
| @pysnooper.snoop(depth=2)
def demo_func():
...
|
2.4 设置调试日志的前缀
当你在使用 PySnooper 跟踪多个函数时,调试的日志会显得杂乱无章,不方便查看。
在这种情况下,PySnooper 提供了一个参数,方便你为不同的函数设置不同的标志,方便你在查看日志时进行区分。
1
2
3
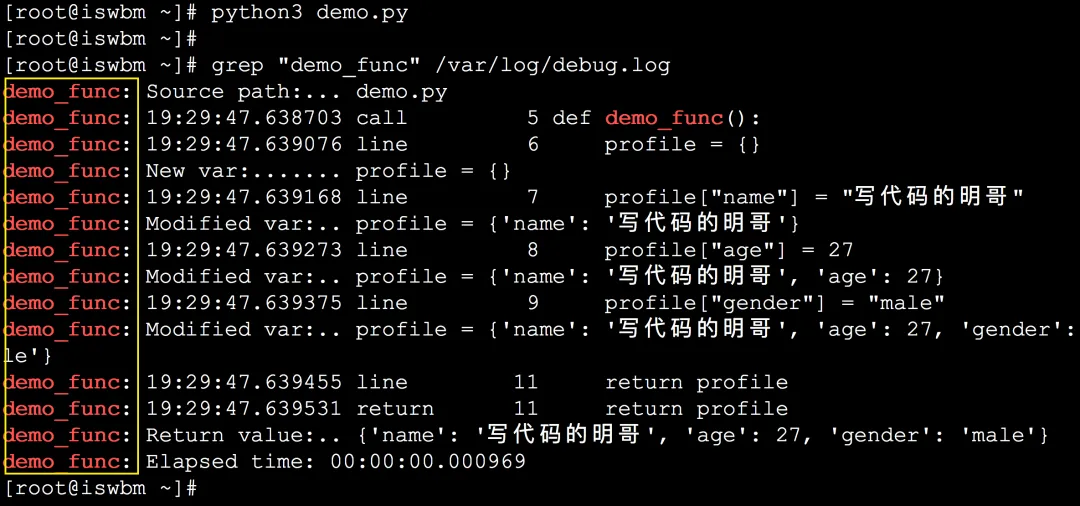
| @pysnooper.snoop(output="/var/log/debug.log", prefix="demo_func: ")
def demo_func():
...
|
效果如下
2.5 设置最大的输出长度
默认情况下,PySnooper 输出的变量和异常信息,如果超过 100 个字符,被会截断为 100 个字符。
当然你也可以通过指定参数 进行修改
1
2
3
| @pysnooper.snoop(max_variable_length=200)
def demo_func():
...
|
您也可以使用max_variable_length=None它从不截断它们。
1
2
3
| @pysnooper.snoop(max_variable_length=None)
def demo_func():
...
|
2.6 支持多线程调试模式
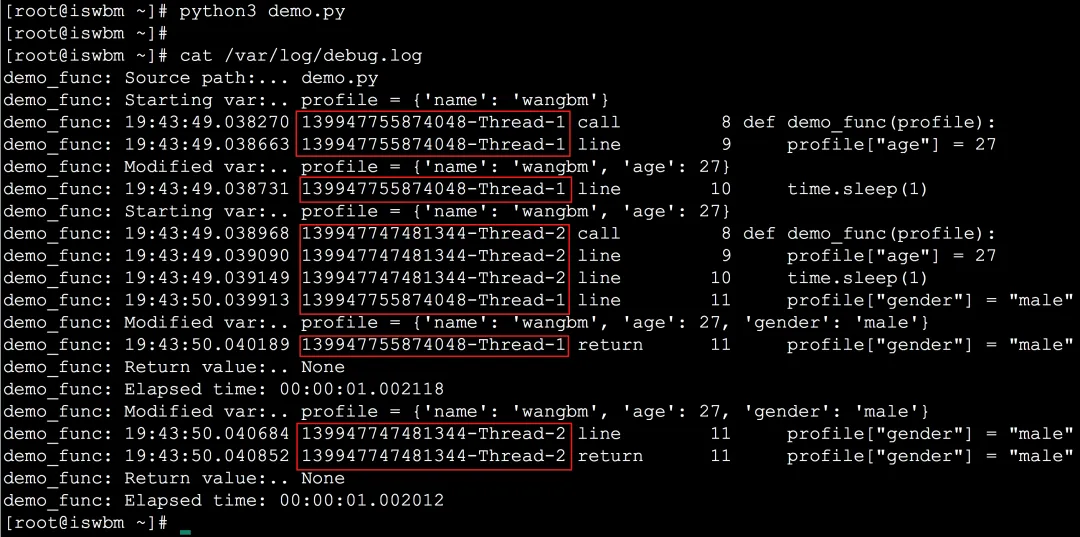
PySnooper 同样支持多线程的调试,通过设置参数 thread_info=True,它就会在日志中打印出是在哪个线程对变量进行的修改。
1
2
3
| @pysnooper.snoop(thread_info=True)
def demo_func():
...
|
效果如下
2.7 自定义对象的格式输出
pysnooper.snoop() 函数有一个参数是 custom_repr,它接收一个元组对象。
在这个元组里,你可以指定特定类型的对象以特定格式进行输出。
这边我举个例子。
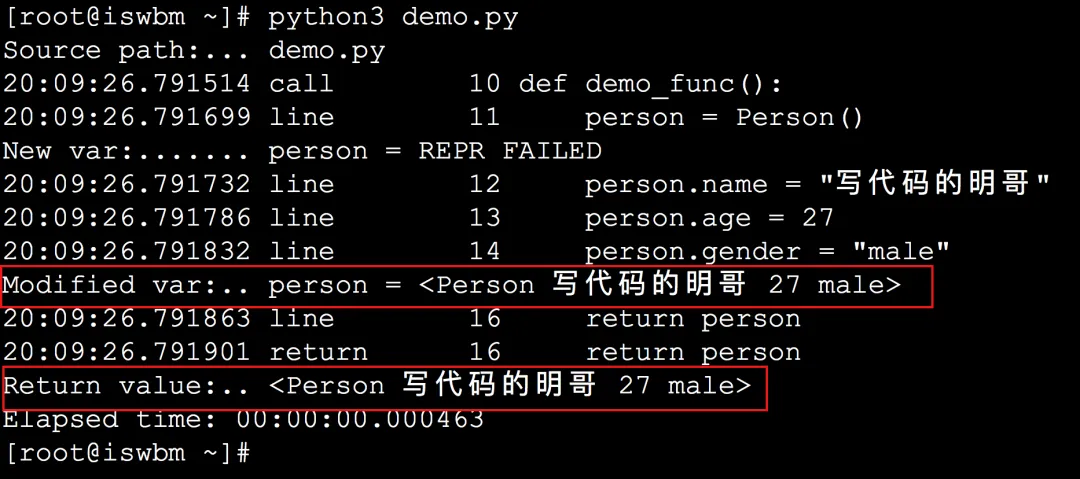
假如我要跟踪 person 这个 Person 类型的对象,由于它不是常规的 Python 基础类型,PySnooper 是无法正常输出它的信息的。
因此我在 pysnooper.snoop() 函数中设置了 custom_repr 参数,该参数的第一个元素为 Person,第二个元素为 print_persion_obj 函数。
PySnooper 在打印对象的调试信息时,会逐个判断它是否是 Person 类型的对象,若是,就将该对象传入 print_persion_obj 函数中,由该函数来决定如何显示这个对象的信息。
1
2
3
4
5
6
7
8
| class Person:pass
def print_person_obj(obj):
return f"<Person {obj.name} {obj.age} {obj.gender}>"
@pysnooper.snoop(custom_repr=(Person, print_person_obj))
def demo_func():
...
|
完整的代码如下
 1
 2
 3
 4
 5
 6
 7
 8
 9
10
11
12
13
14
15
16
17
18
19
20
21
| import pysnooper
class Person:pass
def print_person_obj(obj):
return f"<Person {obj.name} {obj.age} {obj.gender}>"
@pysnooper.snoop(custom_repr=(Person, print_person_obj))
def demo_func():
person = Person()
person.name = "hustbill"
person.age = 27
person.gender = "male"
return person
def main():
profile = demo_func()
main()
|
运行一下,观察一下效果。
如果你要自定义格式输出的有很多个类型,那么 custom_repr 参数的值可以这么写
1
2
3
| @pysnooper.snoop(custom_repr=((Person, print_person_obj), (numpy.ndarray, print_ndarray)))
def demo_func():
...
|
还有一点我提醒一下,元组的第一个元素可以是类型(如类名Person 或者其他基础类型 list等),也可以是一个判断对象类型的函数。
也就是说,下面三种写法是等价的。
 1
 2
 3
 4
 5
 6
 7
 8
 9
10
11
12
13
14
15
16
17
18
19
| # 【第一种写法】
@pysnooper.snoop(custom_repr=(Person, print_persion_obj))
def demo_func():
...
# 【第二种写法】
def is_persion_obj(obj):
return isinstance(obj, Person)
@pysnooper.snoop(custom_repr=(is_persion_obj, print_persion_obj))
def demo_func():
...
# 【第三种写法】
@pysnooper.snoop(custom_repr=(lambda obj: isinstance(obj, Person), print_persion_obj))
def demo_func():
...
|
以上就是今天给大家介绍的一款调试神器(PySnooper) 的详细使用手册。
如果你还有其他关于调试的技巧,可以留言区分享出来,一起学习一下。
(完)
PySnooper作者的Github Repo和博客
PySnooper Github Repo
作者的博客Ram Rachum
“Live as if you were to die tomorrow. Learn as if you were to live forever.” -Gandhi
文章作者
Hustbill billyzhang2010@gmail.com
上次更新
2021-02-21